What Happens When Things Go Near the Speed of Light?
Challenge Home -
Online Resources - Challenge - Assessment - Site Index
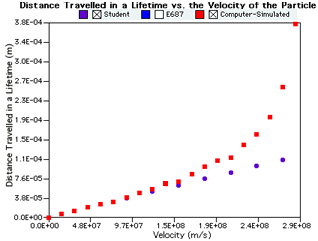 Does your graph of the
computer-simulated data (red) and the values you calculated look like
this one?
(A note about the computer-simulated data)
Does your graph of the
computer-simulated data (red) and the values you calculated look like
this one?
(A note about the computer-simulated data)
Disagreements this far from expectation and this uniform in appearance bear further investigation. Why do faster moving particles go even farther than you expect? Do particles live longer if they are moving very fast?
Project team
Program Contact: Tom Jordan - jordant@fnal.gov
Web Maintainer: ed-webmaster@fnal.gov Last Updated: February 9, 2000
/data/phy_sci/relativity/resultsleft.shtml